Trend intelligence for fashion brands

From the world to your next decision

Modeqa connects long-term shifts in what shoppers value to the next decision for your brand. What to add to the collection, what to say and what to drop – every answer comes with a chain of checkable facts and a confidence level.

  1. Shifts
  2. Season
  3. Demand
  4. Niches
  5. Decisions
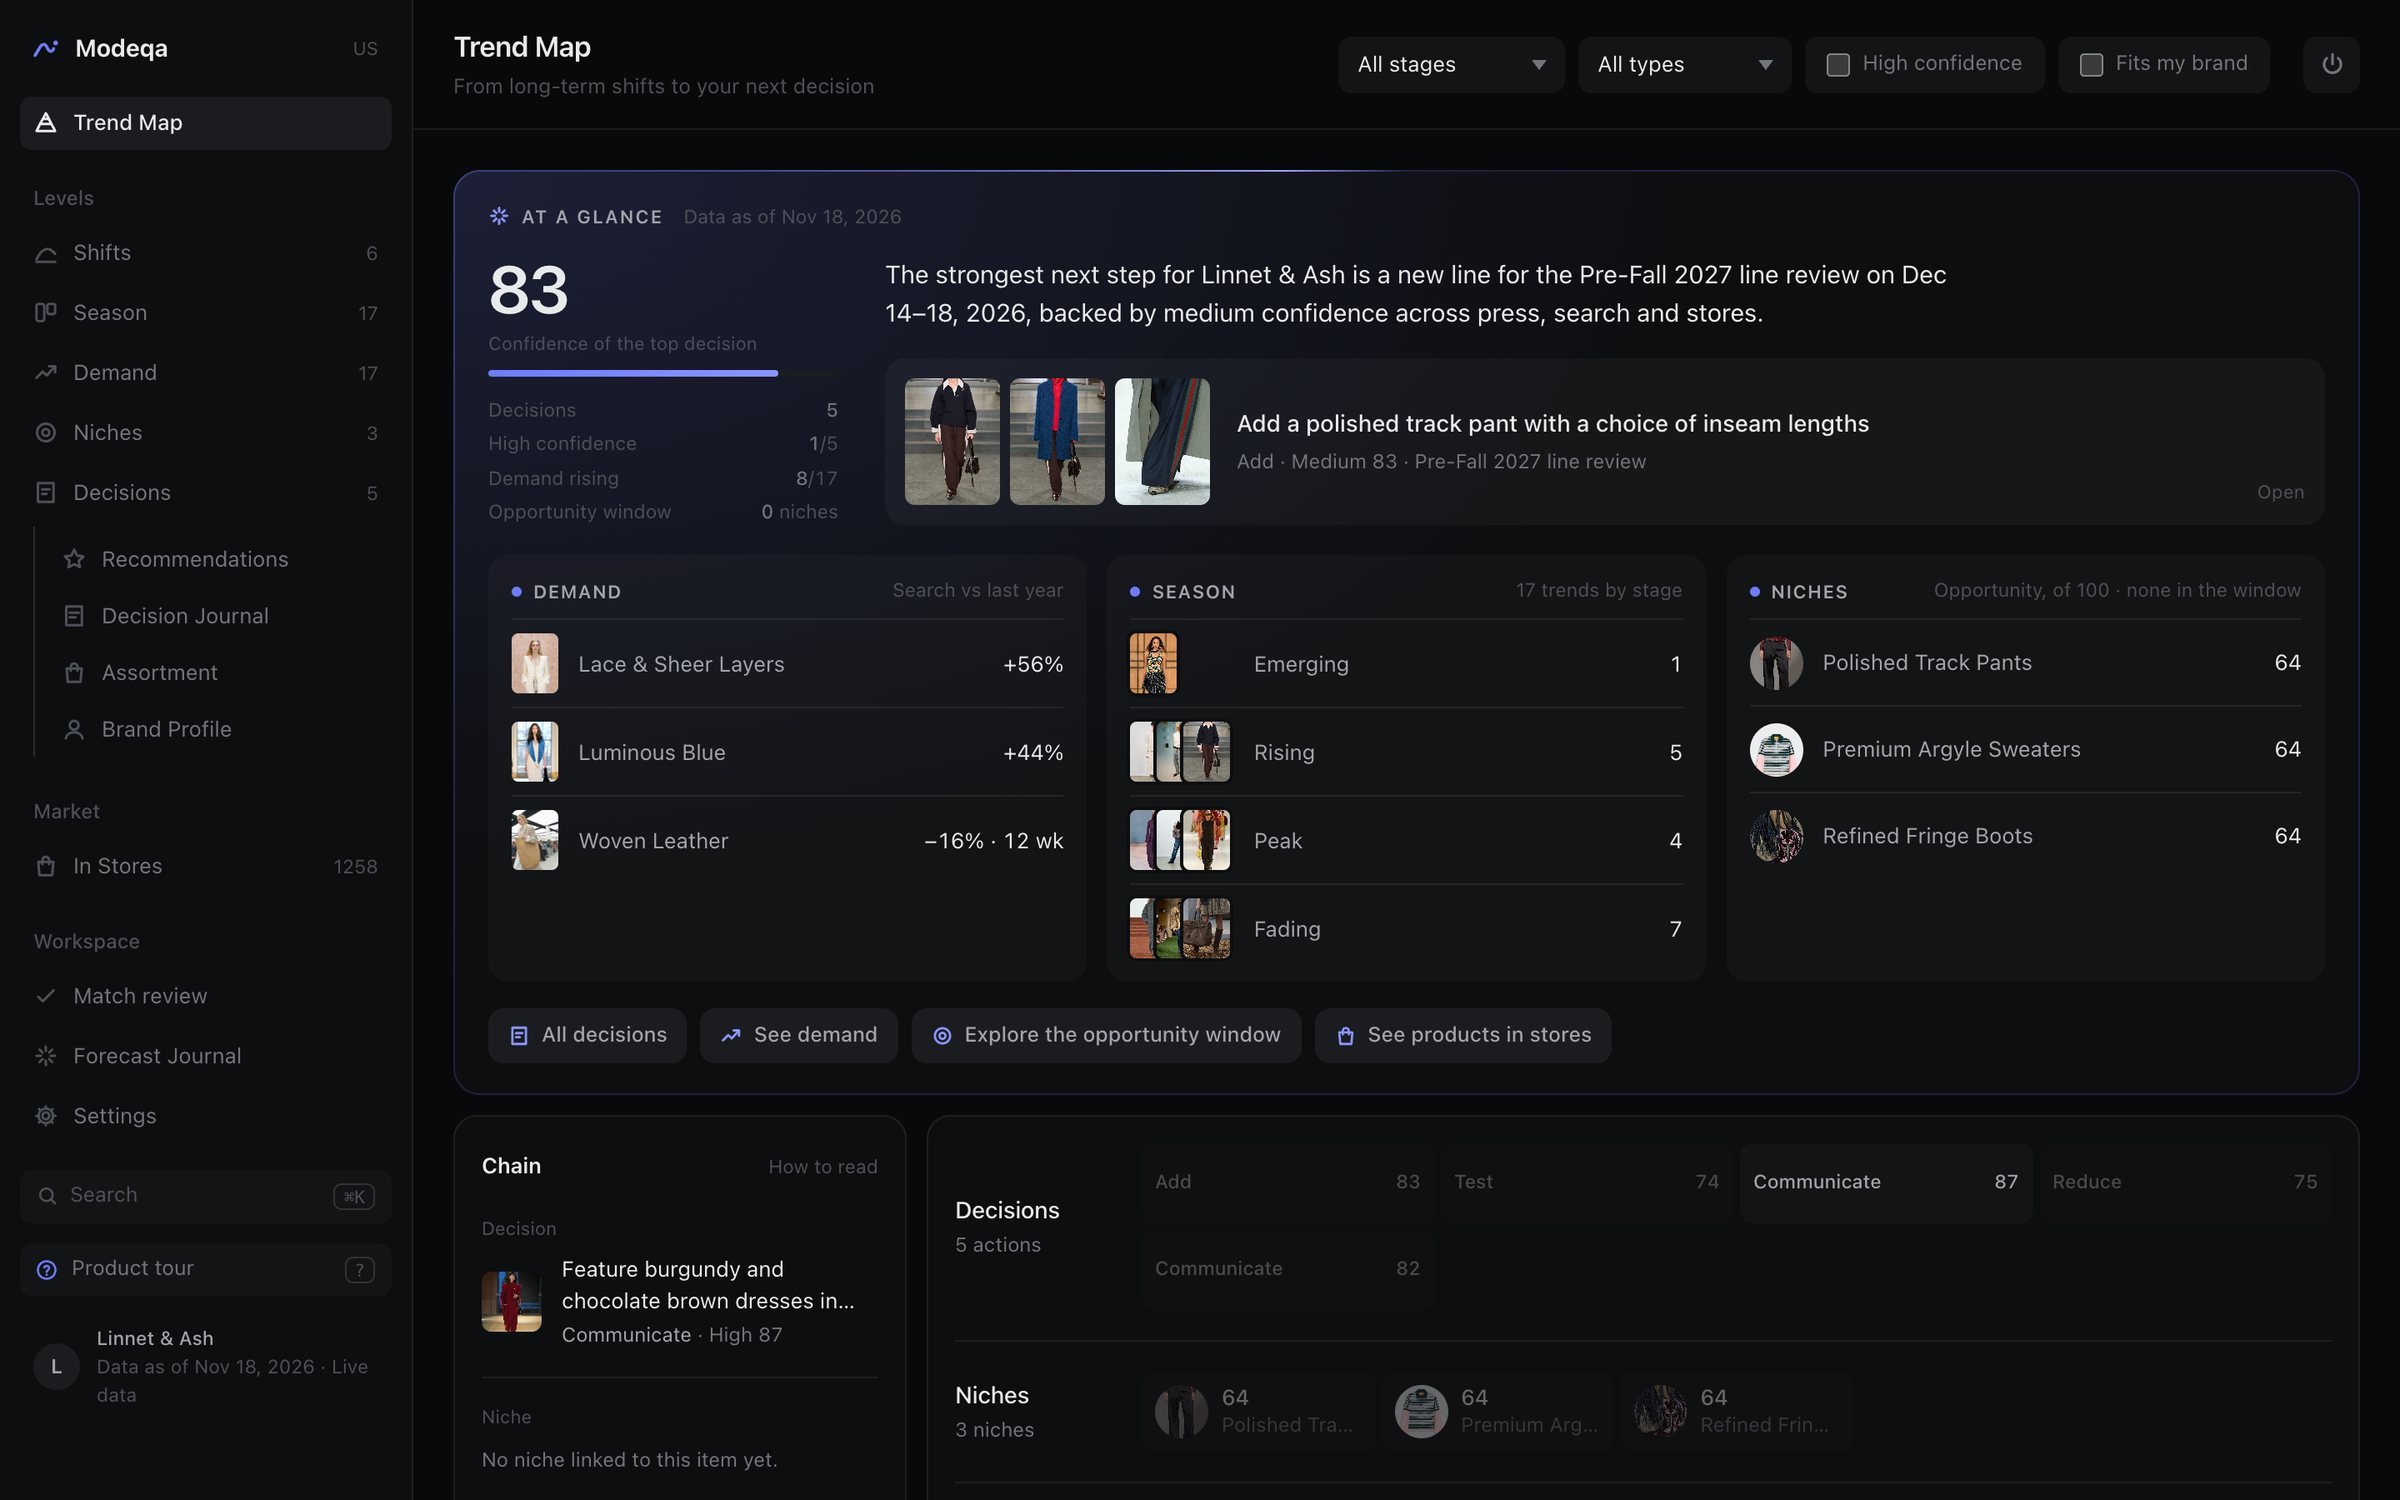
Trend Map: the top decision with its confidence, demand movers, trends by stage and niches
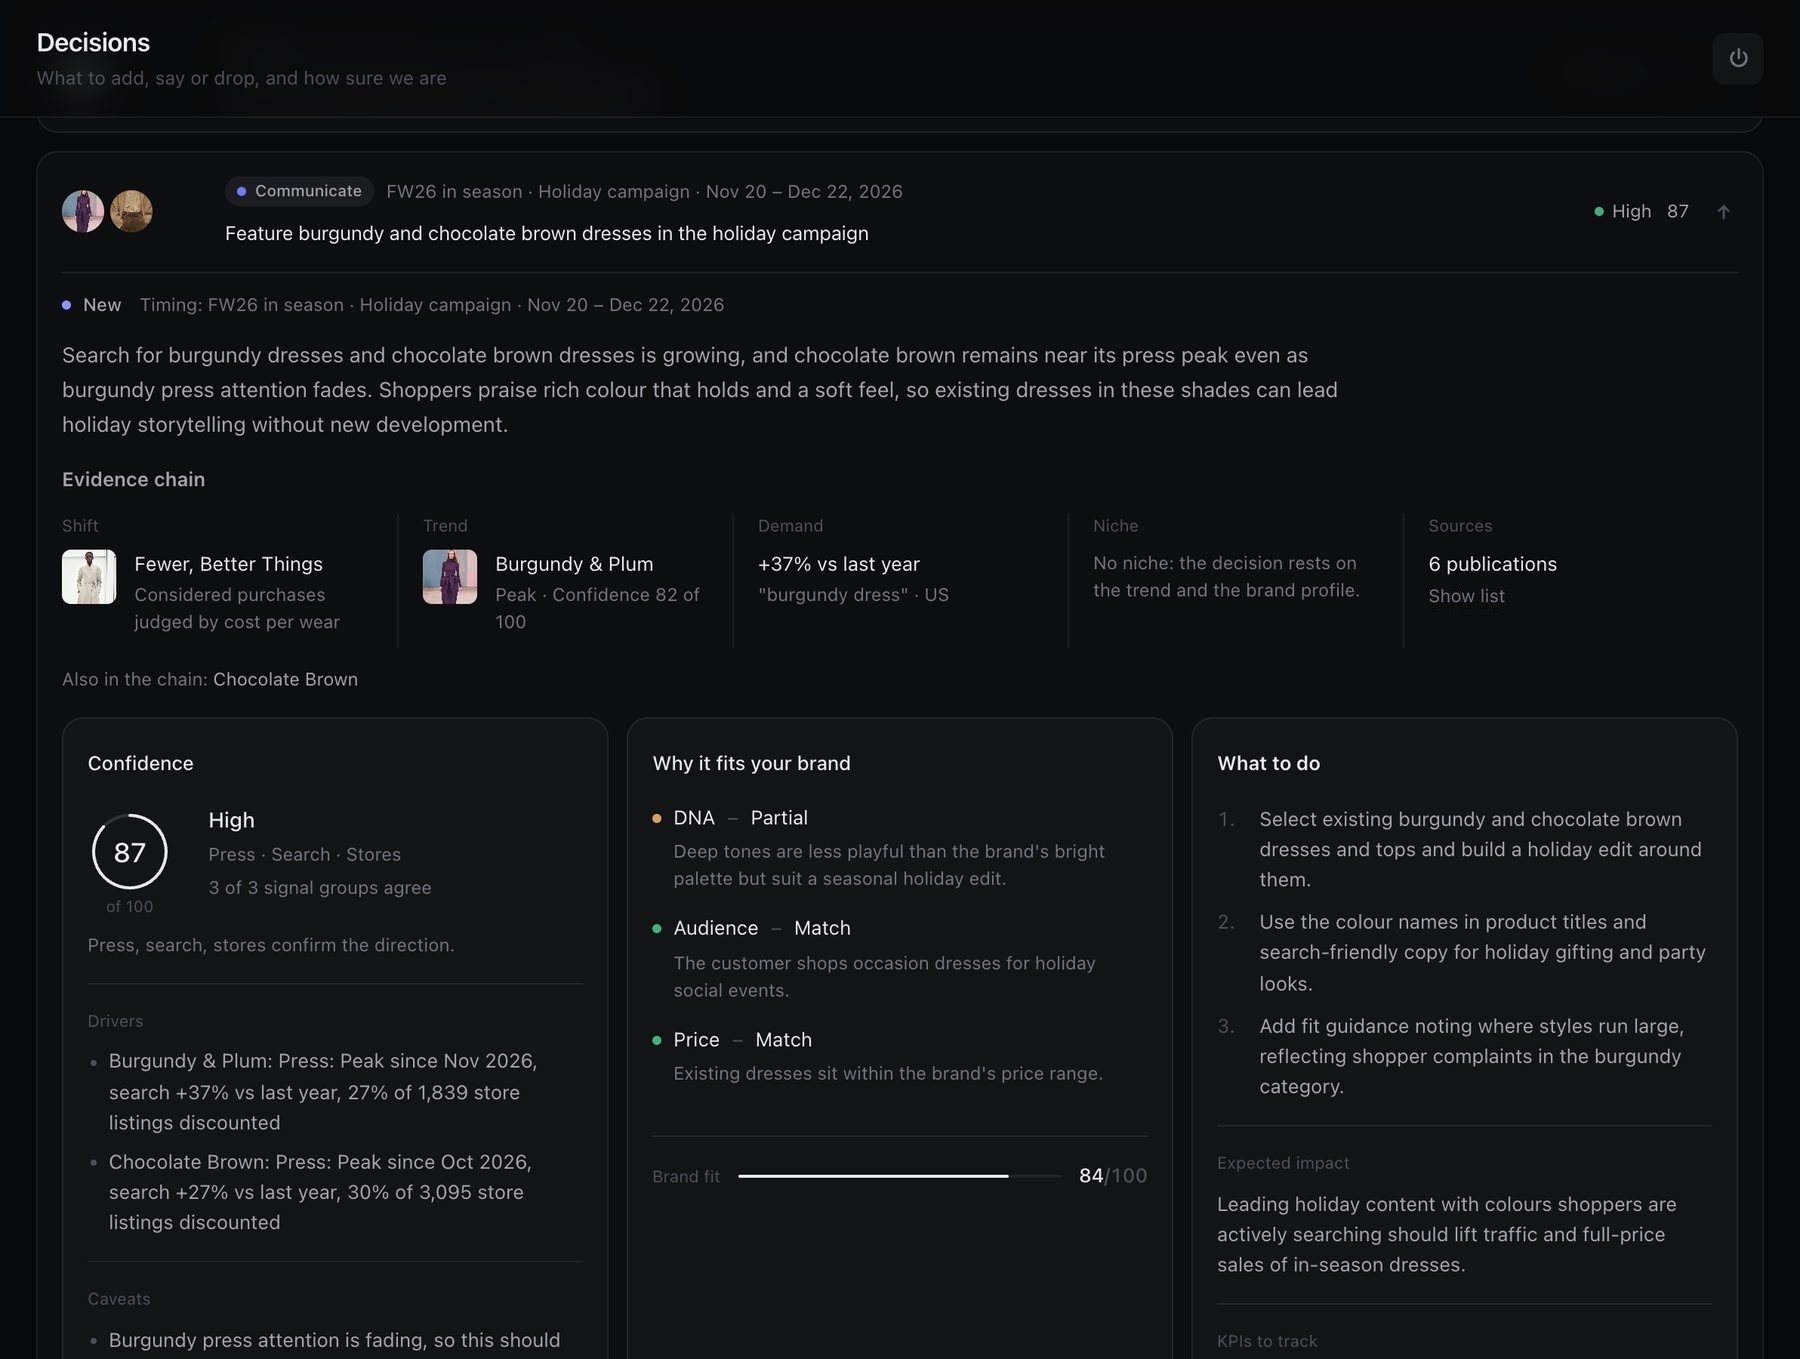
A decision with its evidence chain, confidence and brand fit
  • 187US fashion stores tracked every day
  • 170,859womenswear products in the market scan
  • 17seasonal trends inside 6 long-term shifts
  • 4, 8, 12week forecasts recorded and checked

Figures of the live workspace on Nov 19, 2026.

The problem

Trend reports describe the world. A brand needs its next decision.

Lace & Sheer LayersThree sources, the same week
PressFading
SearchEarly +56%
Stores40% discounted

Signals live apart

Press runs ahead of search and search runs ahead of the shelves. Read one at a time, the three give three different answers about the same trend.

  • Cashmere-Soft KnitsPress · Rising
  • Chocolate BrownPress · Peak
  • Lived-In DenimPress · Rising
Add · SS27 re-buy decision, Jan 2027A light-wash relaxed jean to the core line

Reports stop before the decision

A list of trends does not say which one fits your price, your audience and your categories, or which line review it belongs to.

Lived-In DenimRising trend · share of each catalogGap
Your catalog0
Competitors1.2%
US market0.8%

The catalog is planned without the shelf

Without the market's assortment and prices next to your own, a gap in a rising trend or too much of a fading one shows up only in the markdowns.

How it works

Five connected levels, from long-term shifts to the next decision

Each level answers one question of the brand and links to the levels around it, so every decision can be traced back to the shift and the trend it comes from.

  1. 01Shifts5–10 yearsWhich long-term changes in what shoppers value should define the brand?
  2. 02Season1–4 seasonsWhich colours, textures, silhouettes and styles rise, peak or fade?
  3. 03DemandLast 16 weeksDo shoppers search for it and buy it, where and how much?
  4. 04Niches1–3 seasonsWhere does demand grow while strong offers are few?
  5. 05DecisionsNext decision windowWhat should the brand do, why, on which facts and how sure are we?

The product

Every level is a working screen, not a slide

02 · Season

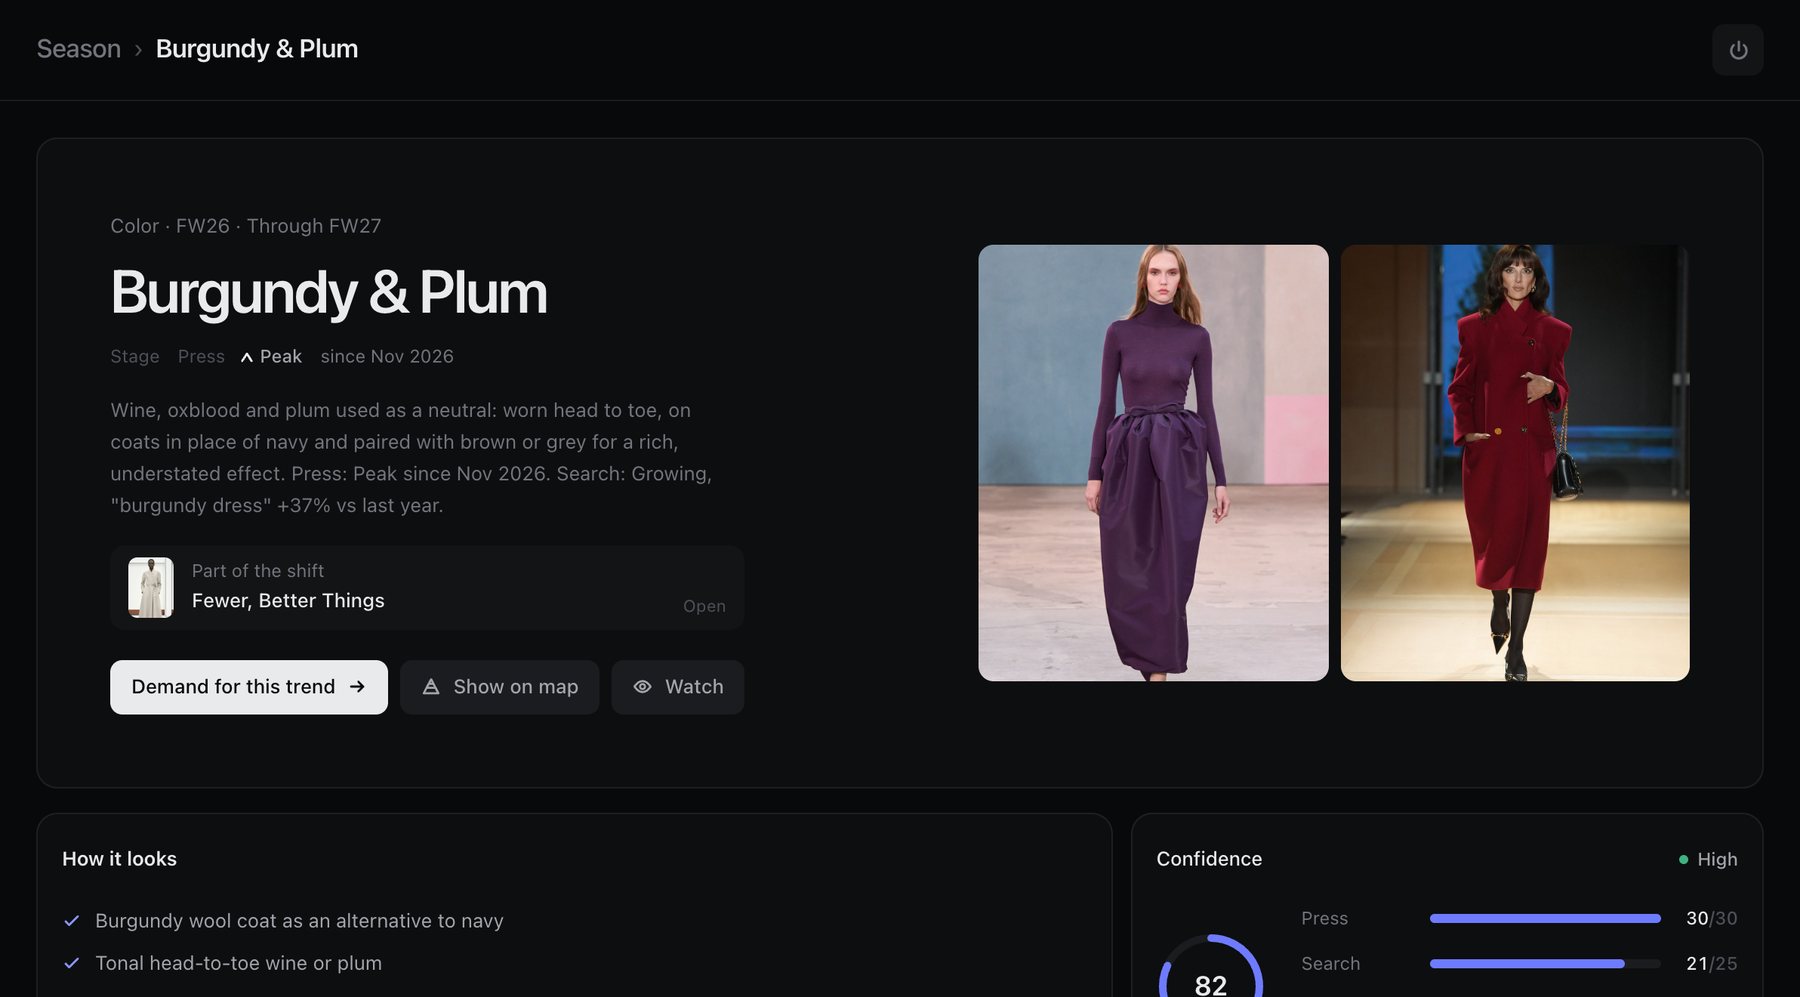
Every trend with its stage and the evidence behind it

  • The stage comes from press attention month by month: Emerging, Rising, Peak or Fading.
  • Confidence out of 100 adds up press, search, stores and consistency, and shows each part.
  • How the trend looks, its palette with colour values and the publications it rests on.
A trend page with its stage, confidence breakdown, palette and runway photos

03 · Demand

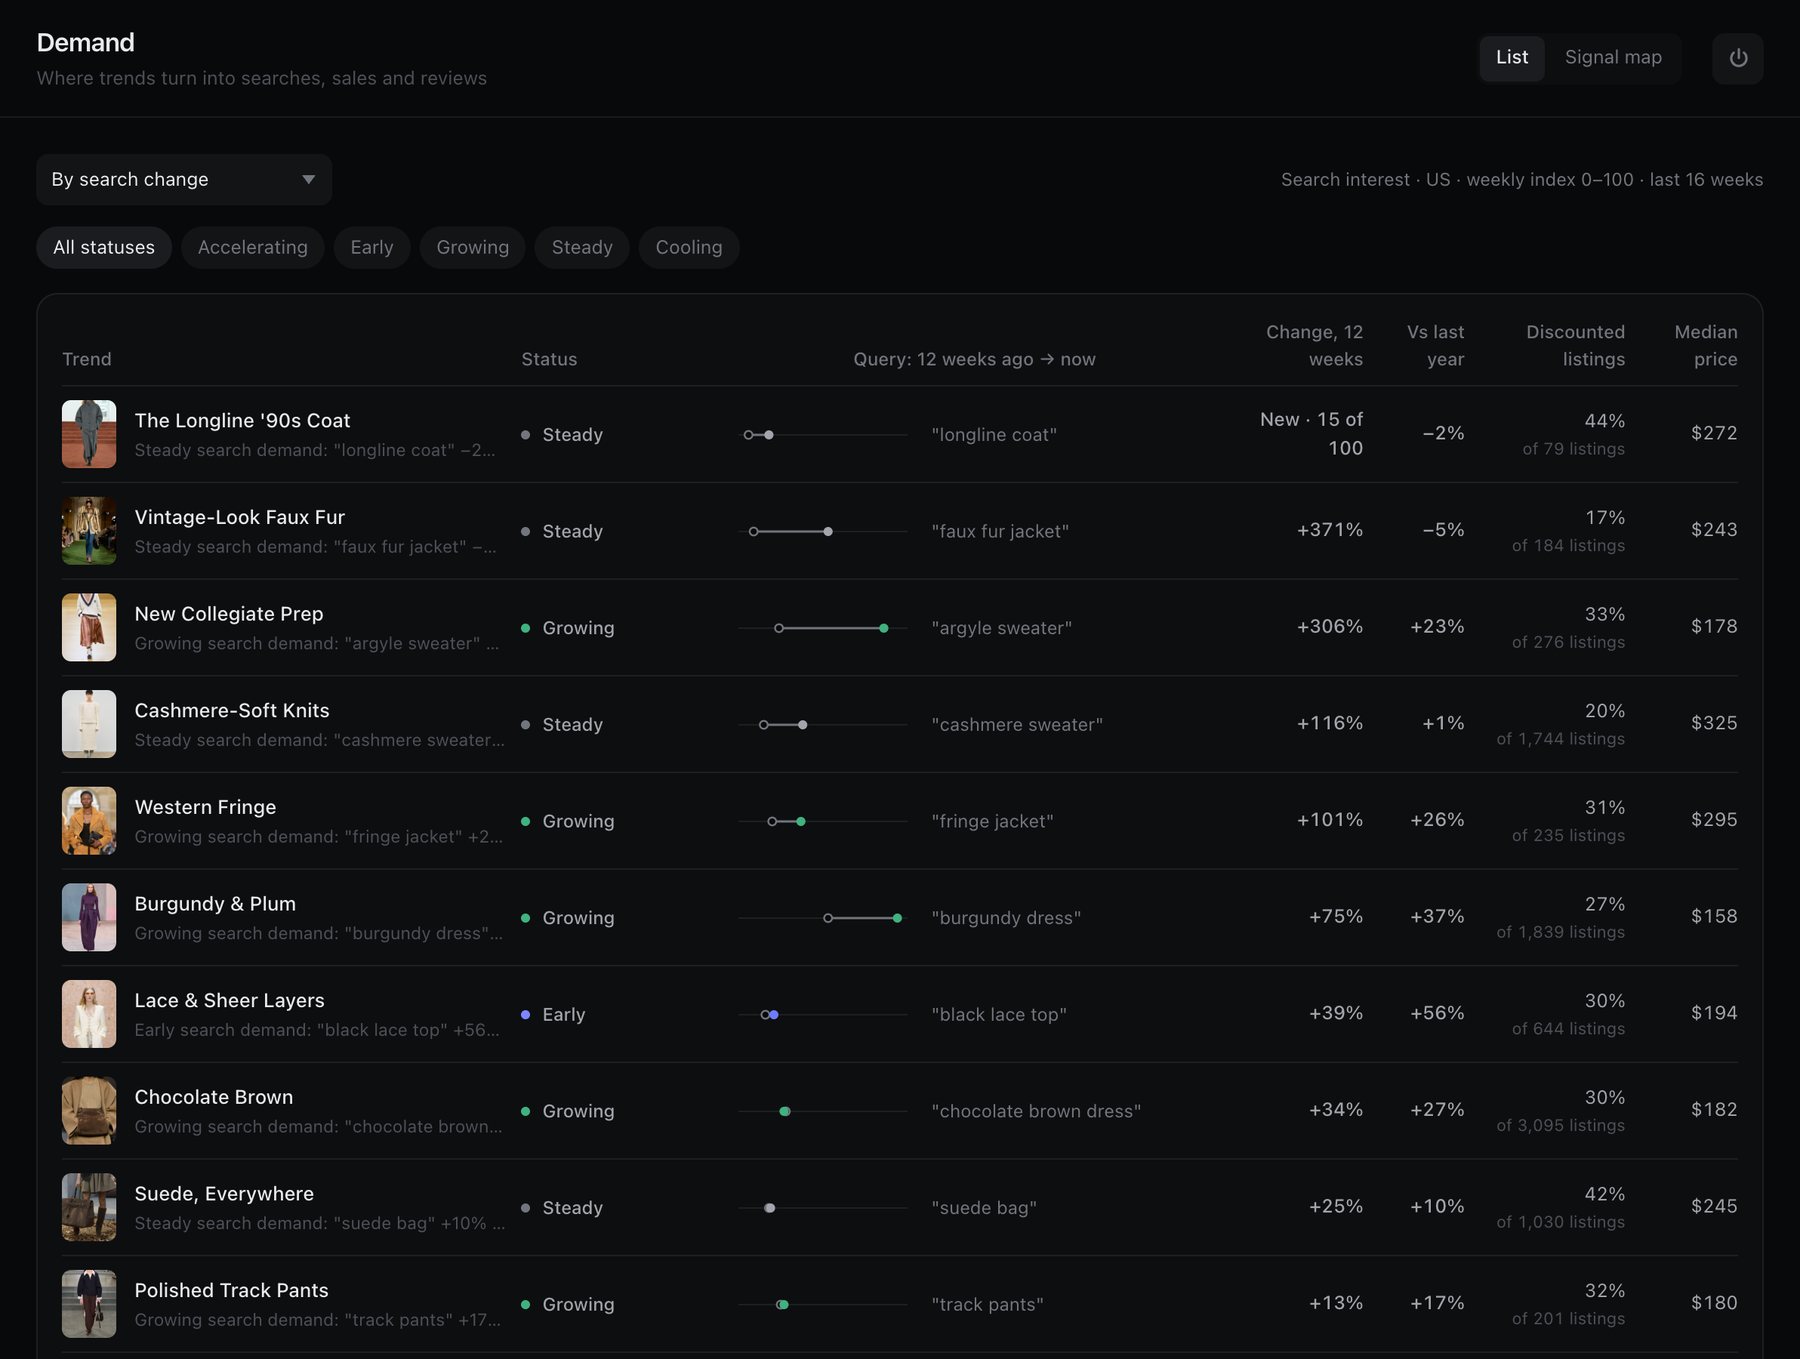
Search and stores instead of opinions

  • The demand status reads the main search phrase of each trend against the same weeks last year.
  • Early, Accelerating, Growing, Steady or Cooling, with the phrase and the change on one scale.
  • The discounted share and the median price of the matching products in US stores.
Demand list: status, search phrase, change against last year, discounted share and median price per trend

04 · Niches

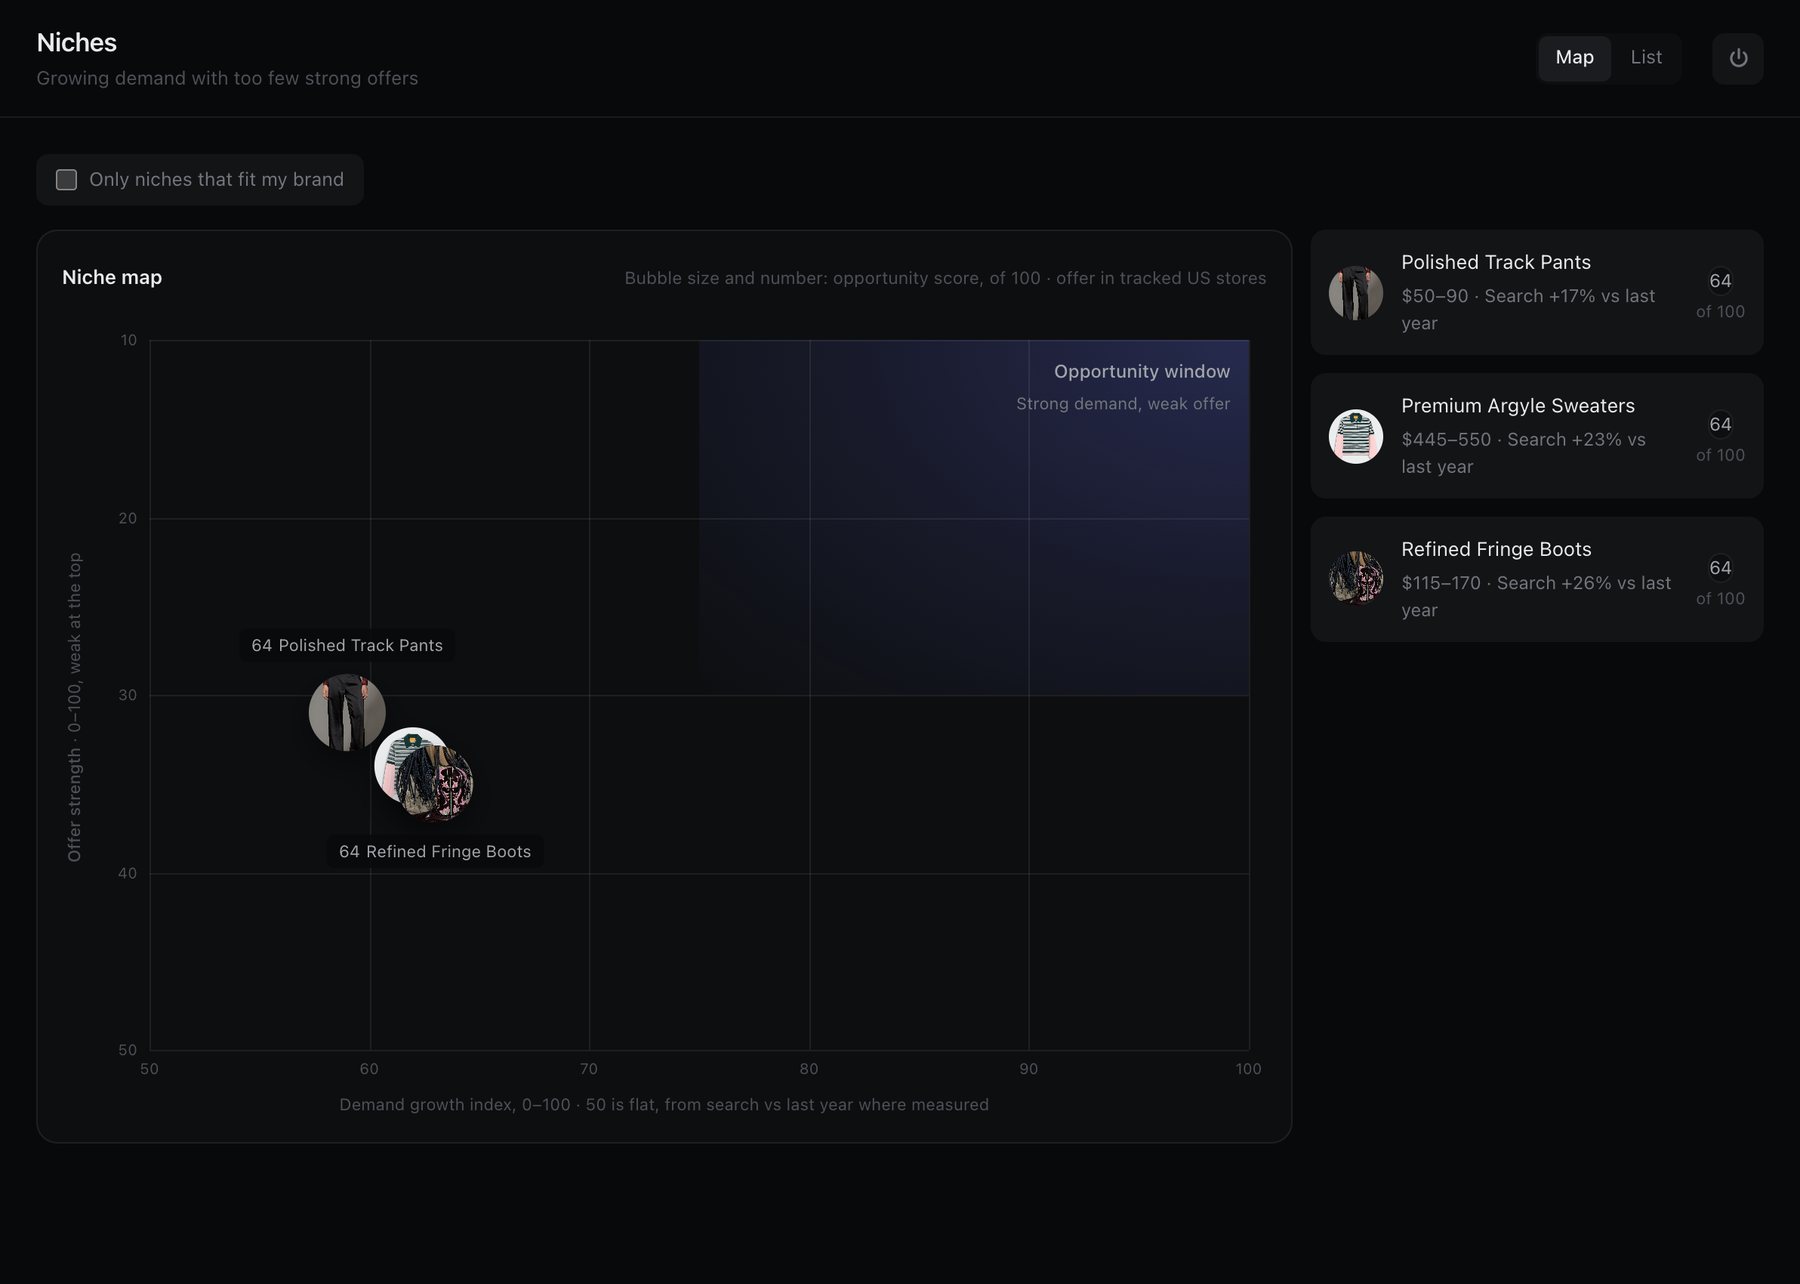
Where demand grows and strong offers are few

  • An opportunity score out of 100 from demand growth, the strength of current offers and what shoppers complain about.
  • A map of demand against offer strength, with the opportunity window marked.
  • A price band for each niche, taken from the tracked stores.
Niche map: demand growth against offer strength with the opportunity window

05 · Decisions

Decisions with a confidence level and the chain behind them

  • Add, Communicate, Reduce or Test, timed to the next line review or campaign.
  • Why it fits your brand line by line – DNA, audience and price – and what to do in steps.
  • How many of the three signal groups agree, the drivers and the caveats.
  • The decision journal records what you decided and what worked.
A decision with the evidence chain from shift to trend, demand and sources

Assortment

Your catalog against the trends, your competitors and the market

Modeqa reads the public catalog, gives every product a role and puts the structure, the trend coverage and the prices next to your competitors and the US market. No sales data is needed.

  • Store linkShopify and other stores with a public catalog
  • Product feedGoogle Merchant, Meta, RSS or Atom
  • Site with a sitemapWordPress, Squarespace, Webflow and other sites
  • CSV exportAny table with a title and a price

Example catalog · 334 womenswear products · data of Nov 19, 2026

Example catalog334 womenswear products
  • Core62.6%
  • Rising trend3.3%
  • Fading trend0.0%
  • Other34.1%
Its competitors5 tracked stores · 7,950 products
  • Core59.9%
  • Rising trend7.9%
  • Fading trend0.4%
  • Other31.8%
US market187 stores · 170,859 products
  • Core33.8%
  • Rising trend5.4%
  • Fading trend1.2%
  • Other59.5%

One dot is one percent of a catalog. Core is the evergreen base: plain colours, simple names, styles kept for six months or more or in three or more colourways, with no tie to a tracked trend.

Method

Numbers you can check

Every figure carries what it measures, its base, its period and its source. A missing value is a dash, never a zero.

Burgundy & PlumSearch for "burgundy dress" Search · Growingstatus of the search phrase +37%vs the same weeks last year Search interestUS · weekly
  1. What is measuredOne search phrase per trend, the words shoppers actually type.
  2. A status by a written ruleEarly, Accelerating, Growing, Steady or Cooling, the same rule for every trend.
  3. A change with its baseAlways against the same weeks of the year before, so the season does not count as growth.
  4. The source and the dateWhere and when the figure was read, next to the figure.
  1. 01Collect187 storesStore catalogs and press every day, search interest every week, all of it public data.
  2. 02JoinOne storyReprints of the same news become one story, so ten outlets repeating one piece do not look like ten signals.
  3. 03ComputeCode onlyEvery figure is computed from the collected data by written rules. The weekly review adds text and judgment only.
  4. 04Check100 pairs a weekPeople review a sample of product and trend matches. An alert fires when precision may fall under 85%.
  5. 05Score4, 8, 12 weeksForecasts are written down before the outcome and scored against search data.

Forecast journal

63 forecasts for 21 trends written for the week of Nov 16. Each gives the chance that search for the phrase is at least 10% above the same weeks last year. A record cannot be edited.

  1. Nov16Written
  2. Dec154-week check
  3. Jan128-week check
  4. Feb912-week check

Add a check date to Google Calendar

Trend and its search phrase nowIn 4 weeksIn 8 weeksIn 12 weeks
Ballet Flats & Ballet SneakersSearch for "ballet flats" · +56% vs last year75%70%65%
Burgundy & PlumSearch for "burgundy dress" · +37% vs last year65%62%59%
Chocolate BrownSearch for "chocolate brown dress" · +27% vs last year65%62%59%
Western FringeSearch for "fringe jacket" · +26% vs last year65%62%59%
New Collegiate PrepSearch for "argyle sweater" · +23% vs last year65%62%59%

Start

Start with your own catalog

Connect the store once. The first report shows the catalog structure, the gaps in rising trends and the prices against the market, and the decisions follow every week.

  1. 01 · OnceConnectA store link, a product feed, a sitemap or a CSV export
  2. 02 · After the first importFirst reportRoles, trend coverage and prices against the market
  3. 03 · Daily or weeklyCatalog refreshStores and feeds every day, sites with a sitemap every week
  4. 04 · Every SaturdayDecisionsAdd, reduce and reprice with the numbers next to the text

FAQ

Questions before you start

What does Modeqa actually do?

It tells a fashion brand which trends are worth acting on and what exactly to do: what to add to the collection, what to talk about and what to drop. Every answer comes with the facts behind it and a clear measure of how sure it is.

Who is it for?

For fashion brands of any size, from a label that has not launched yet to an online store with hundreds of products. Stylists, buyers and studios use it too, to follow the market without a brand of their own.

I don't have a store yet. Can I still use it?

Yes. Describe your brand in a few fields: style, customer, price range and categories. Modeqa picks the trends that suit it, shows where demand grows while strong offers are few and tells you when to act. Once you have a catalog, a report on your own products is added.

How is it different from fashion magazines and trend reports?

Magazines show what looks new. Modeqa checks whether shoppers actually look for it and buy it, and then turns it into a concrete step for your brand with a date to act by.

How do you know a trend is real and not just noise?

A trend counts when the press, shoppers' interest and the products in stores move the same way. A short burst on social media is not enough: it is shown separately as hype, so it never turns into a recommendation on its own.

How sure are the recommendations?

Each one has a score out of 100 and the reasons behind it. Forecasts are also written down in advance and checked weeks later, so you can see how often they turn out right.

Do I need to share my sales or customer data?

No. Modeqa uses only public information. If you have a store, it reads the products you already show on your site, nothing from your back office.

How much of my time does it take?

Setting up the profile takes a few minutes. After that the data updates every day, and the new decisions arrive once a week by email or Telegram.

Which market does it cover?

The United States: womenswear, bags, shoes, jewelry and accessories.

What does Core mean in my catalog report?

Core is your evergreen base: plain colours, simple shapes and styles you keep for months. It brings repeat sales, while trend products keep the offer fresh. The report shows how your balance compares with your competitors and the market.